Features
Protein Contacts Atlas presents different sections, emphasizing different features of a protein's structure. Each view consists of one or more diagrammatic representations of the underlying residue interaction network, coupled to a conventional 3D protein structure view:
All Subunits
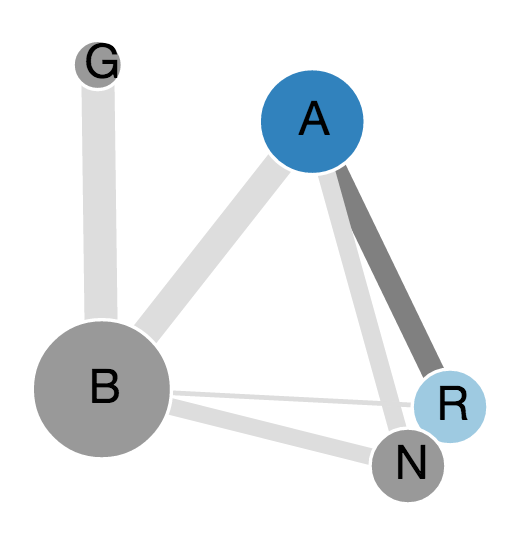
Visualization of the contacts starts with a pop up page displaying the entire structure (PDB) in a network representation. Nodes denote individual chains (subunits) in the structure, which could be proteins, or nucleic acids and links denote the existence of non-covalent contacts among residues across the subunit interface. The thickness of the link is proportional to the number of contacts between the chains. By default the first chain is selected and highlighted on the structure. The other chains (subunits) or edges (interfaces) between them can be clicked to display the interactions of those selected. Clicking on any node (to view interactions in one chain) or link (to view interactions between two chains) will lead to a page with three key visualization panels for sequence, structure and network views which are described in detail in the next section.
The sequence panel shows the secondary structure and sequence information. This panel includes the secondary structures (helices and sheets) on the top line with their respective colours. Below this line is another representation of the secondary structures, which also includes the loops between them. Finally below this line is the sequence with the residue letters. The positions of the residues in the sequence are aligned with the secondary structures and loops above them.
Chord Plot
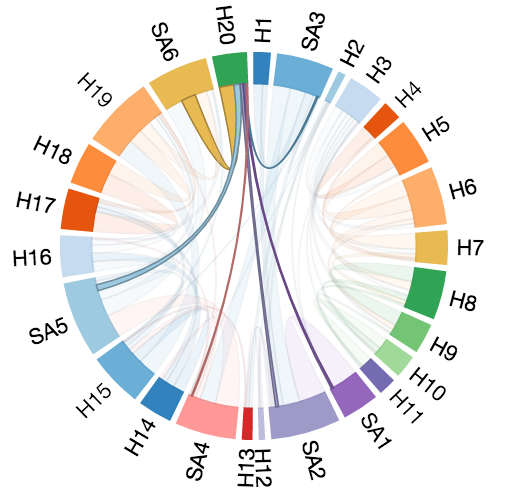
The Structure View consists of a Chord Plot which shows the interactions between pairs of secondary structural elements in which each secondary structural element is represented by an arc of a circle, and arcs are joined by chords whose thickness is determined by the number of interactions between the corresponding elements. Clicking on a chord reveals an adjacency matrix which reveals the specific residue-residue interactions that it represents.
Matrix Plot
Clicking on a chord reveals an adjacency matrix which reveals the specific residue-residue interactions that it represents and the number of atomic contacts between them.
Asteroid Plot
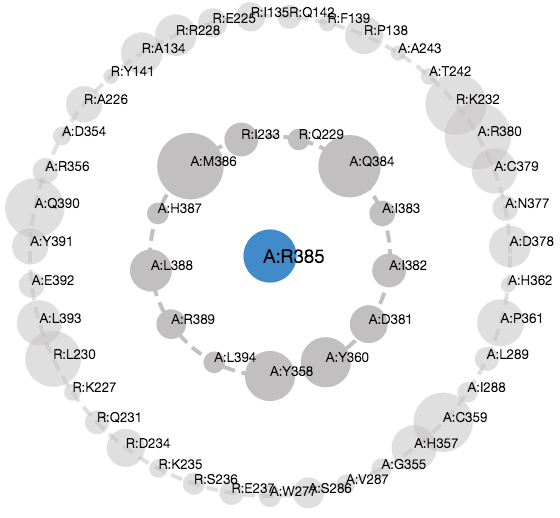
Ligand/Residue Centric View consists of an Asteroid Plot which shows the neighborhood of a particular residue or ligand. This view is simultaneously presented in a diagram of radially arranged circles, and a 3D protein structure view.
Scatter Plot
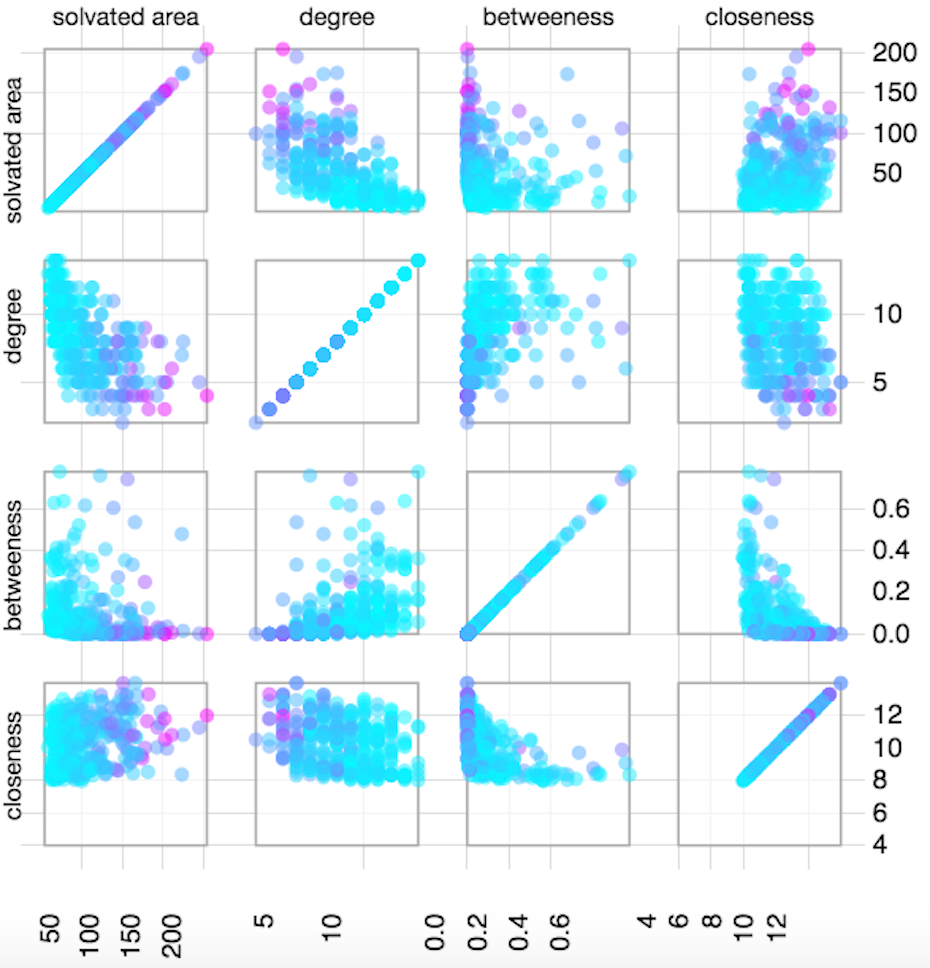
The Network Statistics section has a Scatter Plot Matrix which shows the network metrics corresponding to each residue (Closeness, betweennes and degree centrality measures and solvent accessible area). The main view is a grid of scatter-plots, which includes a plot of every pair of metrics. There is also a sortable table, which gives exact values for each metric.
Extarnal Data Mapping
External data mapping is allowed where the users can upload their data including PTMs, conservation, thermostability etc. in the form provided. The scatter plot matrix is then updated with new data integrated as a color map in which values from minimum to maximum are colored from cyan to magenta by default. The user can change the color scheme with a color palette provided.
Statistics Table
The statistics table provides the degree, betweenness, closeness centrality measures and solvated area of the selected residues.
Contact Network
The network view shows the backbone of the structure as a loop with all the residues as small spheres. The interactions are represented as edges, with the edge thickness signifying the number of atoms that form contacts between the two residues. Only those residues interacting with their neighbors by 4 residues are displayed the first time the network view is clicked. Nevertheless, all contacts can be simultaneously visualized, as all the interactions are pre-calculated.
Disease mutations

Naturally occurring human single nucleotide polymorphisms and disease mutations taken from Uniprot can be viewed on the webserver. Detailed information on the SNP/mutation can be viewed for all the residues in the selected chain and structure.
Pfam mappings

The resource is grouped according to the PFAM IDs of the PDB structures which can be found on the PFAM mappings page. The residue interactions can be downloaded as simple text format accessible here.


